Same-Store Sales Δ-4.2%
Basket Size$34.10
Conversion Rate18.3%
Avg. Dwell Time7.2 min
Shrink %2.8%
GM %31.4%
SKU Velocity0.34
Foot Traffic↓ 11%
Promo Lift1.8×
GMROI2.1
Retail Operations Strategy

Your stores have a strategy problem.
We have the proof.

We walk your floors, read your comps, and rewire everything — from SKU rationalization to traffic conversion — until same-store sales move.

Scroll
Same-Store Sales×SKU Rationalization×Floor Productivity×Basket Size Growth×Traffic Conversion×Margin Recovery×Shrink Reduction×Category Management×Planogram Optimization×Labor Model Efficiency×Same-Store Sales×SKU Rationalization×Floor Productivity×Basket Size Growth×Traffic Conversion×Margin Recovery×Shrink Reduction×Category Management×Planogram Optimization×Labor Model Efficiency×
The Problem, Quantified

The numbers in your comps are telling you something.

Foot Traffic, Q4 YoY↓ Declining
−11%

Mid-market chains losing 1 in 10 visits year-over-year while e-commerce captures the reorder cycle.

Avg Basket Size Erosion↓ Declining
−$3.40

Basket contraction driven by SKU confusion, poor adjacency, and promotional dependency replacing margin.

Gross Margin Compression↓ Declining
−4.2pts

Four points of gross margin lost in 18 months. Every point is $400K per $10M in revenue.

Conversion Rate Floor→ Flat
18%

Traffic enters. Most leaves without transacting. The gap between visits and rings is your strategy problem.

Same-Store Sales Index — 24-Month RollingMid-Market Composite
Grocery / Convenience
Fashion / Apparel
Home / Big-Box
Index base: 100 · Source: Strategize proprietary composite
The Diagnostic Framework

Five chapters.
One clear diagnosis.

The same framework we run on every engagement — adapted from 200+ retail floor audits across grocery, fashion, and big-box. Download the full version.

01
Traffic AnatomyDecompose foot traffic by source, day-part, and zone. Identify which traffic is converting and which is leaking.
02
SKU Rationalization MatrixVelocity × margin scoring across the full assortment. Cut what is costing you turns without moving the needle.
03
Floor Productivity AuditSales per square foot by department, adjacency scoring, planogram compliance rate, and dead-zone mapping.
04
Margin Recovery LeversPromo dependency index, shrink attribution, labor-to-sales ratio, and the 7 levers that move gross margin in 90 days.
05
Competitive Position MapPrice index, assortment overlap, and convenience score versus the three formats most likely stealing your basket.
Sample: Diagnostic Priority Matrix
TrafficBasketConversionMarginVelocity
Grocery
Fashion
Home / BB
Specialty
Amber = primary diagnostic focus for format

Download the Retail Diagnostic Framework

48 pages. No gating except your work email. We send one follow-up.

No spam. One follow-up email. Unsubscribe anytime.

The Team

They don't theorize.
They walk your floors.

Every consultant on our team has held P&L responsibility inside a retail operation before they ever advised one.

Marcus Okafor reviewing store planogram in retail aisle
+18%
Same-store sales in 2 quarters

I walked into their flagship at 9 AM on a Tuesday. By noon I had identified four adjacency failures and a planogram that was costing them $2M in annual velocity. The fix was structural, not promotional.

Marcus OkaforSenior Retail Operations Partner17 years on the floor
Priya Nair reviewing tablet data near stockroom door in retail environment
−31%
SKU count, +4.1pt margin lift

They had 2,400 SKUs in a 6,000 sq ft format. Half were under 0.3 turns per week. Rationalization is not about cutting — it is about making every facing fight for its slot.
Priya NairCategory & SKU Strategy Lead12 years in category management
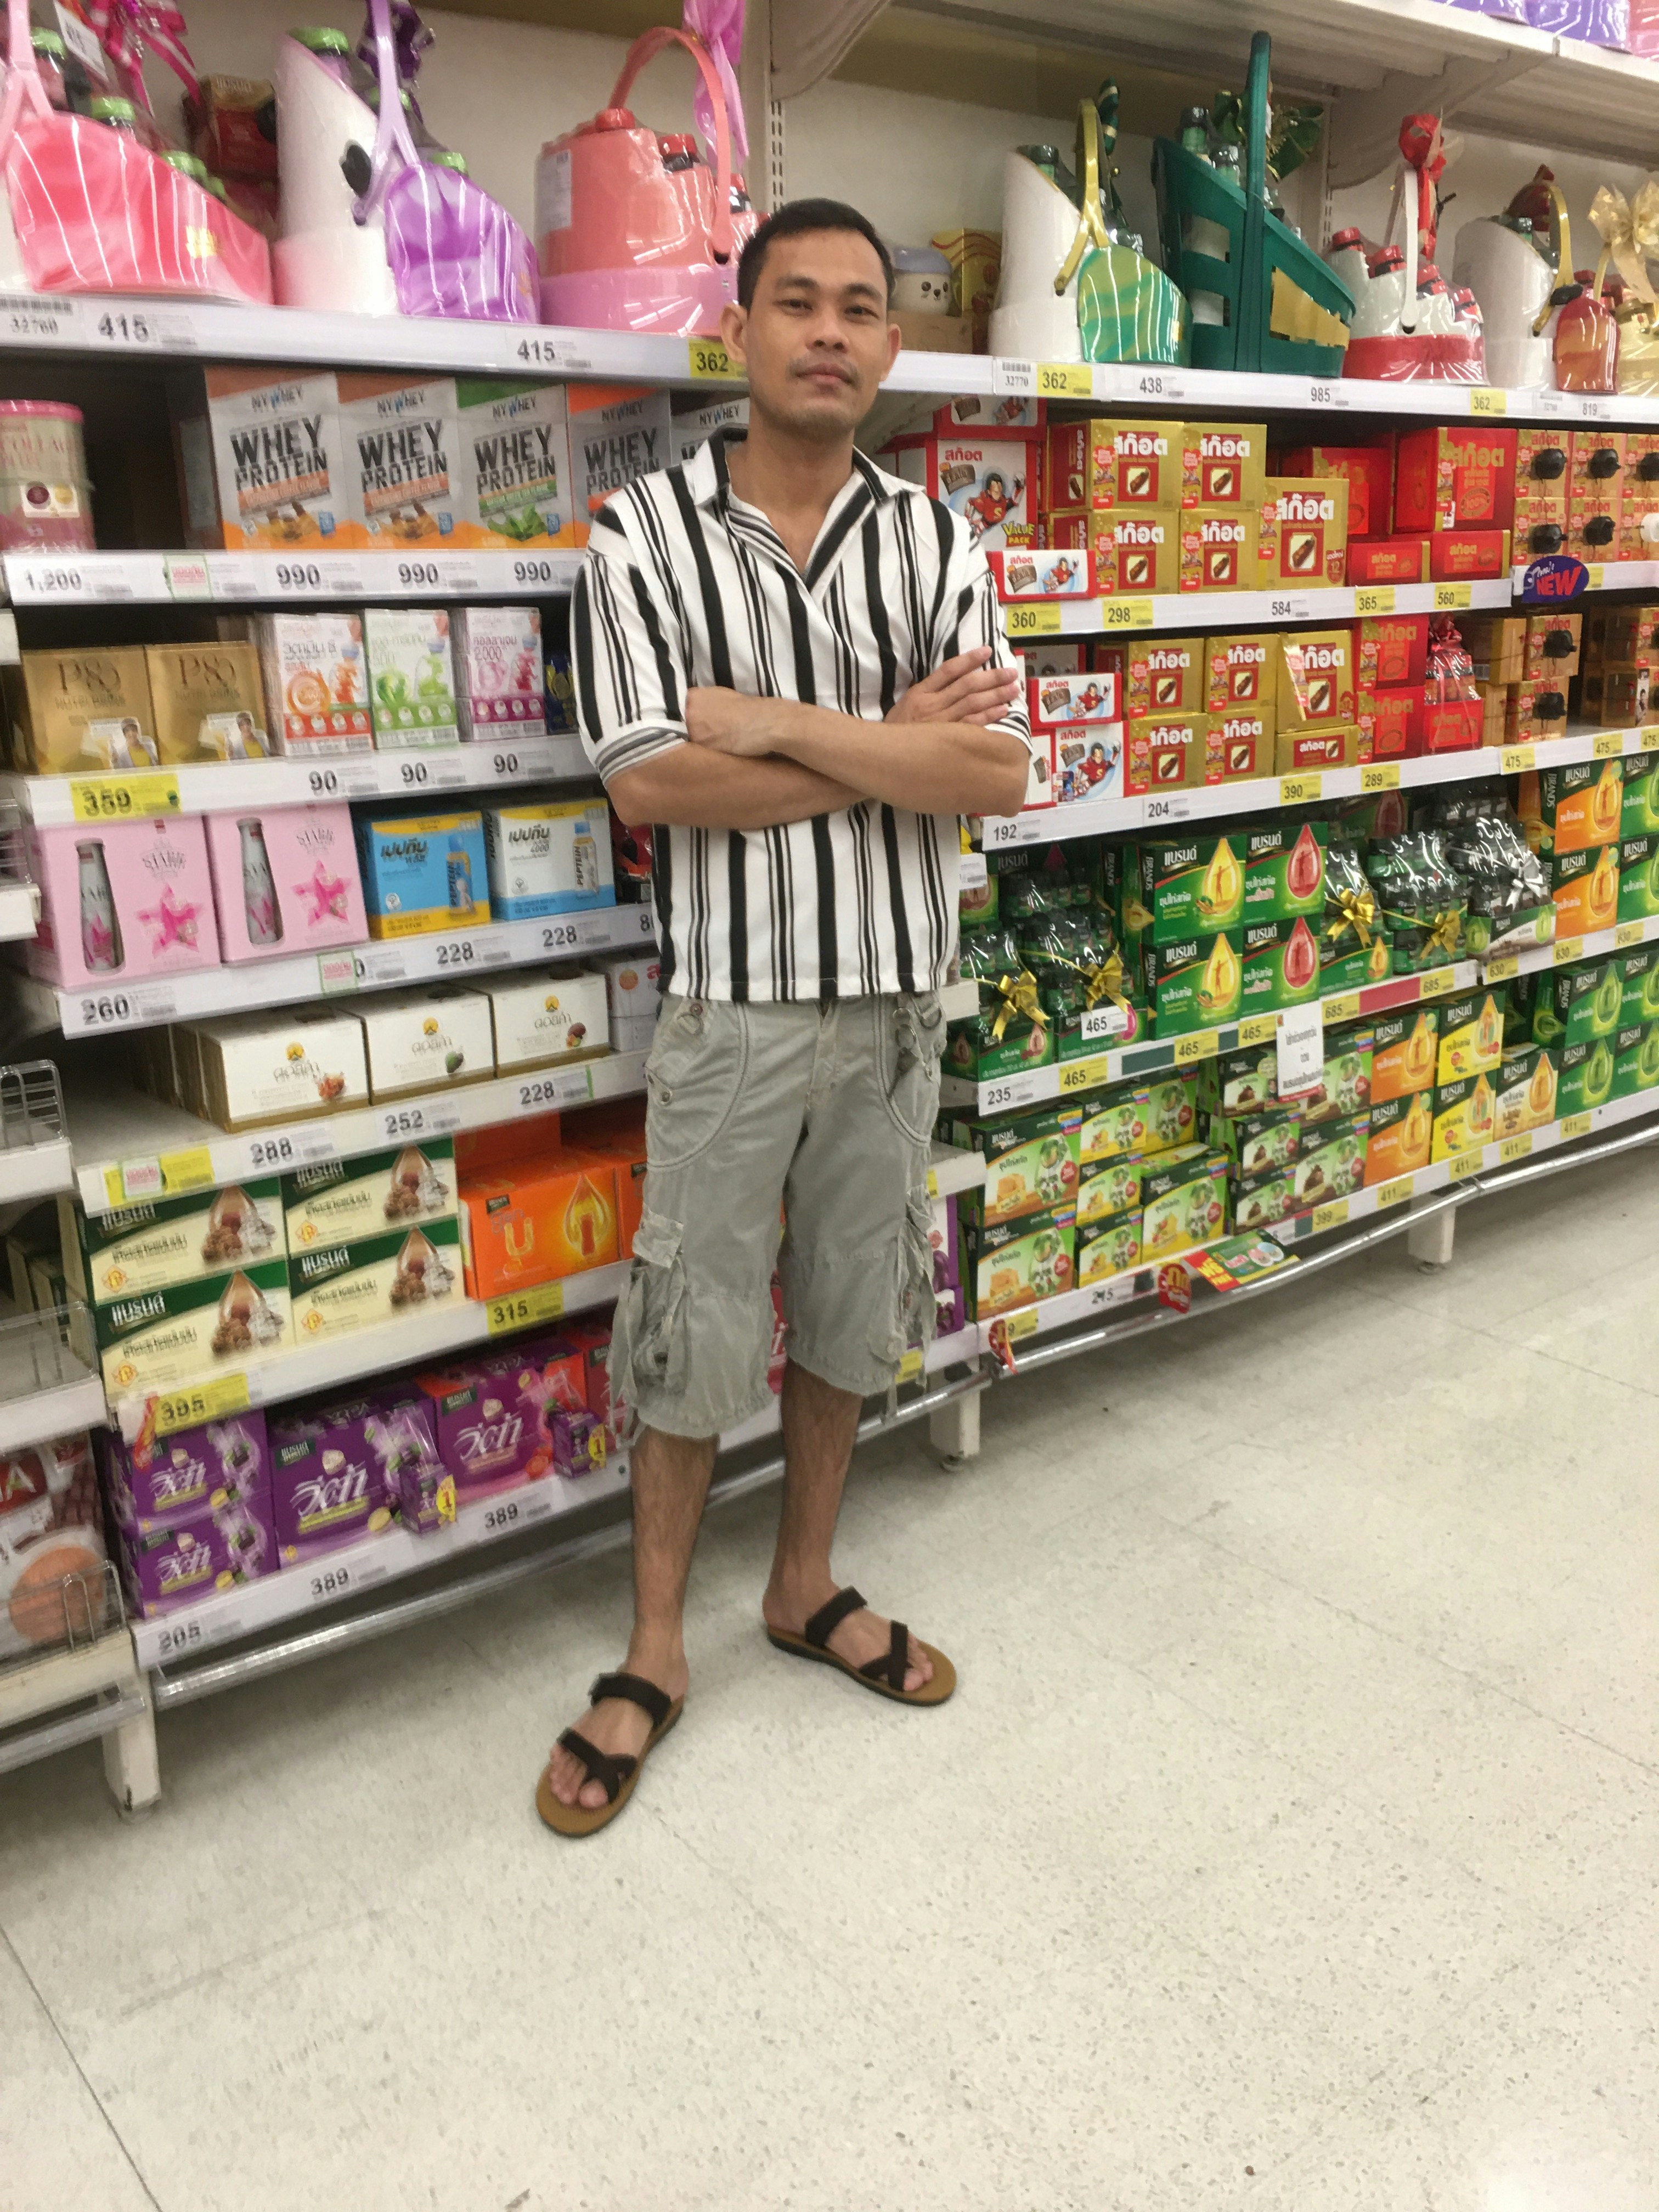
Derek Callahan standing arms crossed in empty retail aisle
+9.4pts
Conversion rate lift in 60 days

Conversion problems are never one thing. It is always a sequence — the wrong category at the entrance, a dead zone at the back wall, checkout friction that bleeds 8% of your baskets. You fix the sequence.

Derek CallahanTraffic & Conversion Architect14 years in retail analytics
Evidence

Three formats.
One consistent outcome.

Specific numbers from closed engagements. All figures verified and available for reference calls.

Regional Grocery
Midwest grocery chain, 44 stores

Same-store sales declining 6.2% YoY. Basket erosion, category confusion, and a promo dependency that was burning 3.8pts of gross margin.

Same-store sales+18% in 2Q
Gross margin+3.1pts
SKU count reduction−22%
90-day engagement
Fashion / Apparel
Specialty fashion brand, 18 flagship doors

Conversion rate flatlined at 17.4% across flagships. Traffic was healthy. The floor layout was killing the transaction.

Conversion rate+9.4pts
Units per transaction+1.3
Revenue per sq ft+$42
60-day engagement
Home / Big-Box
Big-box divisional, 31-store rationalization

Tasked with closing 31 underperforming stores without destroying brand equity or comp-store momentum in the remaining portfolio.

Retained comp base sales94%
Inventory liquidation$18M recovered
Brand NPS post-closureNo decline
6-month engagement
$2.4B
Total retail revenue under active diagnostic management across current client portfolio
200+
Floor audits conducted across grocery, fashion, home, and specialty retail since 2018
4.3pts
Average gross margin improvement across all completed engagements in the last 36 months
Direct Access

Thirty minutes.
A real diagnosis.

Book a 30-minute Store Review call. We will ask four questions about your current comps and tell you exactly where we think the problem lives. No deck. No pitch. Just the diagnosis.

< 2 business daysResponse time
No NDA requiredFor initial call
Senior partnerOn every call